This is the first second of some of my look back on 2014 posts. To see the other ones, take a look at the jahresrückblick14-tag
Introduction
I tracked my location data with OpenPaths since the beginning of 2014. OpenPaths comes as an application for your phone, which tracks its location, uploads it to the OpenPath servers, where you can donate your data for scientific research, and look at the data yourself.
To do this, we grab a .CSV file with the location data. Log in to OpenPaths, and click on CSV under Download my data, which gives you a comma separated list of your location data, which can then visualize with R, which is what we’ve done here.
Data
We want to plot the location points on a map, which we can do with the wonderful ggmap library. First, we load the CSV file and display a summary of the data.
[code lang=r]
library(ggmap)
data summary(data$lat)
summary(data$lon)
summary(data$alt)
[/code]
[code lang=text]
## lat
## Min. 1st Qu. Median Mean 3rd Qu. Max.
## 34.6 46.9 47.2 46.0 47.5 53.6
## lon
## Min. 1st Qu. Median Mean 3rd Qu. Max.
## 4.76 7.50 8.20 21.80 8.22 141.00
## alt
## Min. 1st Qu. Median Mean 3rd Qu. Max.
## -48 353 380 463 546 2670
[/code]
In 2014 I was somewhere in woods somewhere in Romania in the mean, and somewhere in Beromüster as the median.
[code lang=r]
summary(data$device)
summary(data$os)
[/code]
[code lang=text]
## device
## iPhone4,1 iPhone6,2
## 13453 1093
## os
## 7.0.4 7.0.6 7.1 7.1.1 7.1.2 8.0 8.0.2 8.1 8.1.1 8.1.2
## 829 261 2238 2065 1551 145 6095 479 449 434
[/code]
We see that in 2014 I changed from an iPhone 4S (iPhone4,1) to an iPhone 5S (iPhone6,2) and went through 10 different iOS version numbers.
Location data
Extremes
Interesting points in our data are
- The minimal and maximal latitudes of 34.601 and 53.5866, South and North.
- the minimal and maximal longitudes of 4.762 to 141.1744, East and West.
- as well as the altitude, which ranges from -48 AMSL to 2671 AMSL.
We can get the extreme points out of the data pretty easily. To do so, we subset the data depending on the value we want to have, build a Location from these points, grab the map from that location, display this map and add a pointer.
For the most northern point, this goes like so:
[code lang=python]
NLocation = c(lon = subset(data, lat == max(data$lat))$lon[1], lat = subset(data,
lat == max(data$lat))$lat[1])
mapImage zoom = 15)
ggmap(mapImage) + geom_point(aes(x = subset(data, lat == max(data$lat))$lon[1],
y = subset(data, lat == max(data$lat))$lat[1]), alpha = 0.5, color = "darkred",
size = 10) + ggtitle("Northmost point in 2014")
[/code]
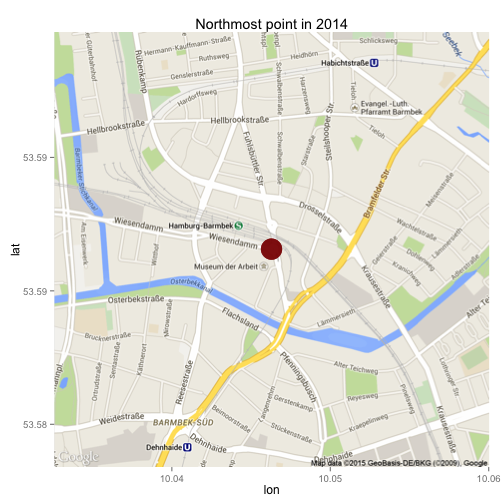
We see that in 2014 I was in Hamburg, which is the northmost point. Correctly, the northmost point would be in Oslo, where I spent New Years Eve 2013/2014, but I’ve only really started to use OpenPaths in mid-January 2014…
The rest of the extremes can be extracted accordingly.
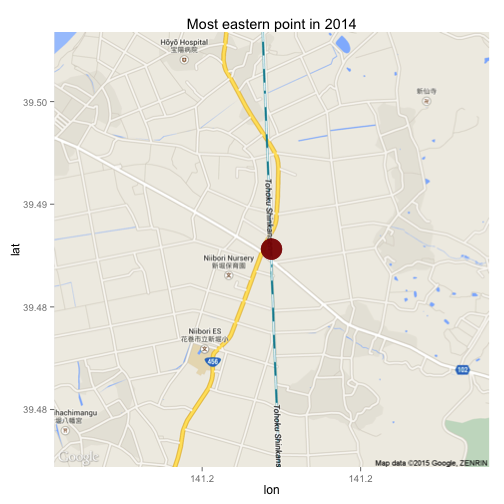
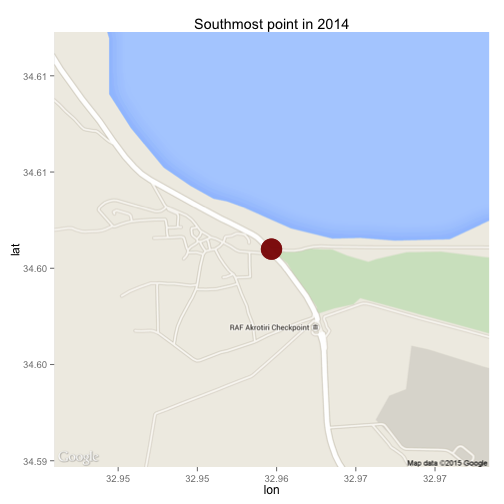
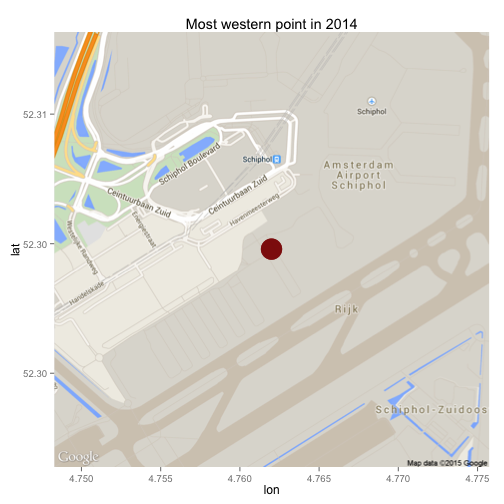
The most eastern point was (unsurprisingly) in Japan, the southmost point in Cyprus and the most eastern point in Amsterdam (while flying to Japan).
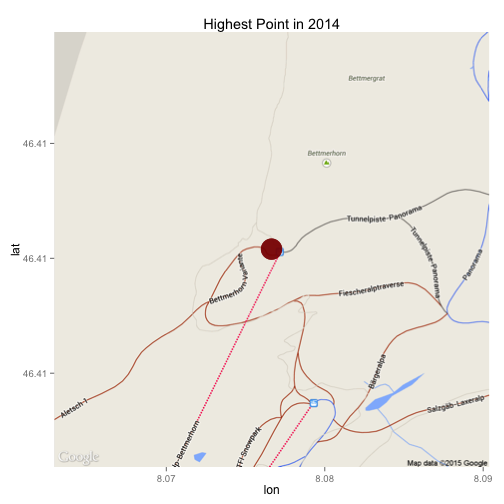
The highest peak I reached in 2014 was the Bettmerhorn, probably while skiing. The lowest point at -48 AMSL was at home and is probably a fluke in the GPS data :)
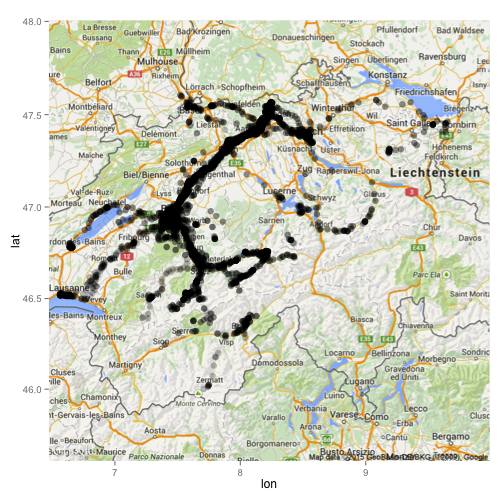
Where was I in Switzerland?
To plot the obtained data on a map, we have to center the resulting map location. Since I only want to show the data points in Switzerland, we center the map on that. Afterwards, we can simply plot all the data points on top of that image, and you can see where I was in Switzerland in 2014.
[code lang=r]
HomeBase zoom = 8)
AllPoints ggmap(HomeBase) + geom_point(aes(x = lon, y = lat), data = AllPoints, size = 3,
alpha = 0.25)
[/code]
If you’d like to see the full R code (in R Markdown), you can take a look at the OpenPaths.Rmd on my GitHub account.
