Ein kurzer Zombie-Film, der etwas anders ist als alle anderen Zombie-Filme. Und mir fast ein Träänli in die Augen trieb. Aber seht selbst.
Ein kurzer Zombie-Film, der etwas anders ist als alle anderen Zombie-Filme. Und mir fast ein Träänli in die Augen trieb. Aber seht selbst.
Über Neujahr waren wir in Unterbäch. Vom Dachfenster aus hatten wir eine prima Sicht aufs Bietschhorn, leider war der Himmel nur an einem Abend halbwegs wolkenlos.
Weil ich den Fotoapparat aufs Dach gestellt habe, ist diese kurze Zeitraffer-Sequenz herausgekommen. Gut zwei Stunden, komprimiert auf 10 Sekunden.
Dann habe ich mich gefragt, wie es ächt aussehen würde, wenn die Sterne stillstehen und habe die Fotos als Fingerübung mit hugin ao ausgerichtet, dass die Sterne fixiert bleiben (Wen’s interessiert wie, der/die fragt in den Kommentaren nacht).
Mit still stehenden Sternen sieht das dann so aus.
Und – wie schon in der Konkordia-Hütte – hab’ ich auch ohne Kompass wieder recht gut gegen Norden gezielt
Hier ein weiterer meiner Jahresrückblick 2015-Posts. Die anderen sind unter dem Tag jahresrückblick15 zu finden.
Weil das letzte Mal schon auf Englisch, hier grad wieder.
I’ve updated the RMarkdown-document of the “analysis” of my yearly Geodata a bit. Namely, I parametrized the shizzle out of it, switched to the freely available Stamen maps (based on OpenStreetMap data) and – something which I’m quite prowd of myself – implemented a function to automagically extract the name of a location based on its latitude and longitude from the GeoNames database.
The original file with the full code can be found either on GitHub or on RPubs, the result is pasted below.
I tracked my location data with OpenPaths since the beginning of 2014.
OpenPaths comes as an application for your phone, which tracks its location, uploads it to the OpenPath servers.
You can then donate your data for scientific research and also look at the data yourself, which is what we do here.
To be able to do this, we grab a .CSV file with the location data.
Log in to OpenPaths, and click on CSV under Download my data, which gives you a comma separated list of your location data, which can then visualize with R, which is what we’ve done here.
We want to plot the location points on a map, which we can do with the wonderful ggmap library.
To get the place names from the GeoNames Web Services, we need the RCurl library, to parse the output XML, we obviously need the XML library.
First, we load the data file and then remove all the datapoints where we have an altitudes of ‘0’ (which is probably a fluke in the GPS data)
Obviously, we only want to look at this years data, we thus save a subset of the dataset for further processing.
library(ggmap)
library(RCurl)
library(XML)
data <- read.csv("/Users/habi/Dev/R/openpaths_habi.csv")
data$alt[data$alt == 0] <- NA
whichyear <- 2015
thisyear <- subset(data, grepl(whichyear, data$date))
Since we’re going to use it often, we’re making a function to grab the name of a place based on its latitude and longitude.
geoname <- function(lat,lon){
  # Grab GeoNames XML from their API, according to location
  txt = getURL(paste0("http://api.geonames.org/findNearbyPostalCodes?lat=", lat, "&lng=", lon, "&username=habi", collabse = NULL), .encoding = 'UTF-8', .mapUnicode = TRUE)
  # Parse XML tree
  xmldata <- htmlTreeParse(txt, asText=TRUE)
  # Extract <name> node (with empirically found location)
  Name <- xmldata$children[[2]][[1]][[1]][[1]][[2]][[1]]
  # Since we're only using the name as string, we can return it as such
 return(unlist(Name)[[2]])
}
Then, we display a summary of the geographical points.
summary(thisyear$lat)
##    Min. 1st Qu.  Median    Mean 3rd Qu.    Max.
##   45.92   46.94   47.01   47.14   47.45   50.05
summary(thisyear$lon)
##    Min. 1st Qu.  Median    Mean 3rd Qu.    Max.
##   6.562   7.432   7.695   7.826   8.211   9.999
summary(thisyear$alt)
##    Min. 1st Qu.  Median    Mean 3rd Qu.    Max.    NA's
##   84.85  363.10  533.00  541.90  554.20 3400.00     228
In 2015 I was in the mean somewhere close to Auswil.
I’ve lived at 541.9 m AMSL in the mean.
The .csv file also contains information about the iPhone we’ve used to collect the data.
Let’s look at these.
summary(thisyear$device)
## iPhone4,1 iPhone6,2
##         0      8290
We see that in 2015 I have only used one phone, my iPhone 5S (iPhone6,2) and went through 9 different iOS version numbers.
summary(thisyear$os)
## 7.0.4 7.0.6   7.1 7.1.1 7.1.2   8.0 8.0.2   8.1 8.1.1 8.1.2 8.1.3   8.2
##     0     0     0     0     0     0     0     0     0   614   933   347
##   8.3   8.4   9.0   9.1   9.2 9.2.1
##  1653   374  1365  1808   997   199
If we assume that I’ve tracked my location consistently, then I’ve used iOS 9.1 the longest, with 1808 saved data points.
Interesting points in my yearly location data:
We can get the extreme points out of the data pretty easily.
To do so, we subset the data depending on the value we want to have, construct a Location from these points, grab the map tile from that location, put a marker on top of it and display this is an image.
For the northmost point, this goes like so:
NLocation = c(lon=subset(thisyear, lat==max(thisyear$lat))$lon[1],
              lat=subset(thisyear, lat==max(thisyear$lat))$lat[1])
mapImage<- get_map(location= NLocation, source='stamen', maptype='toner-hybrid', zoom=10)
ggmap(mapImage) +
  geom_point(aes(x = subset(thisyear, lat==max(thisyear$lat))$lon[1],
                 y = subset(thisyear, lat==max(thisyear$lat))$lat[1]),
             alpha = .125,
             color="darkred",
             size = 10) +
  ggtitle(paste("Northmost point in", whichyear))
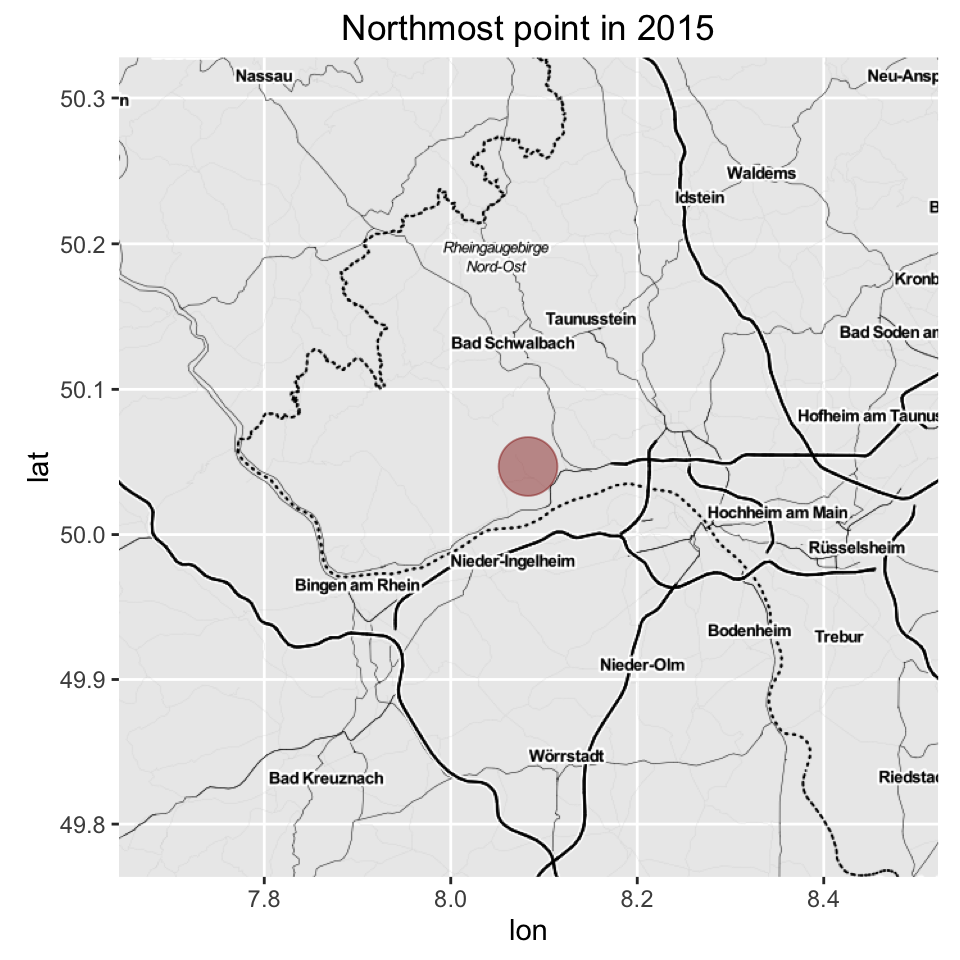
The northmost point in 2015 is in Kiedrich, which is true.
Even though I’ve not been in Kiedrich exactly, my mobile phone was probably connected to a tower there.
I spent two days in Ingelheim in January, at the International Masters competition in Swimming, which is close by.
The rest of the extremes can be extracted accordingly.
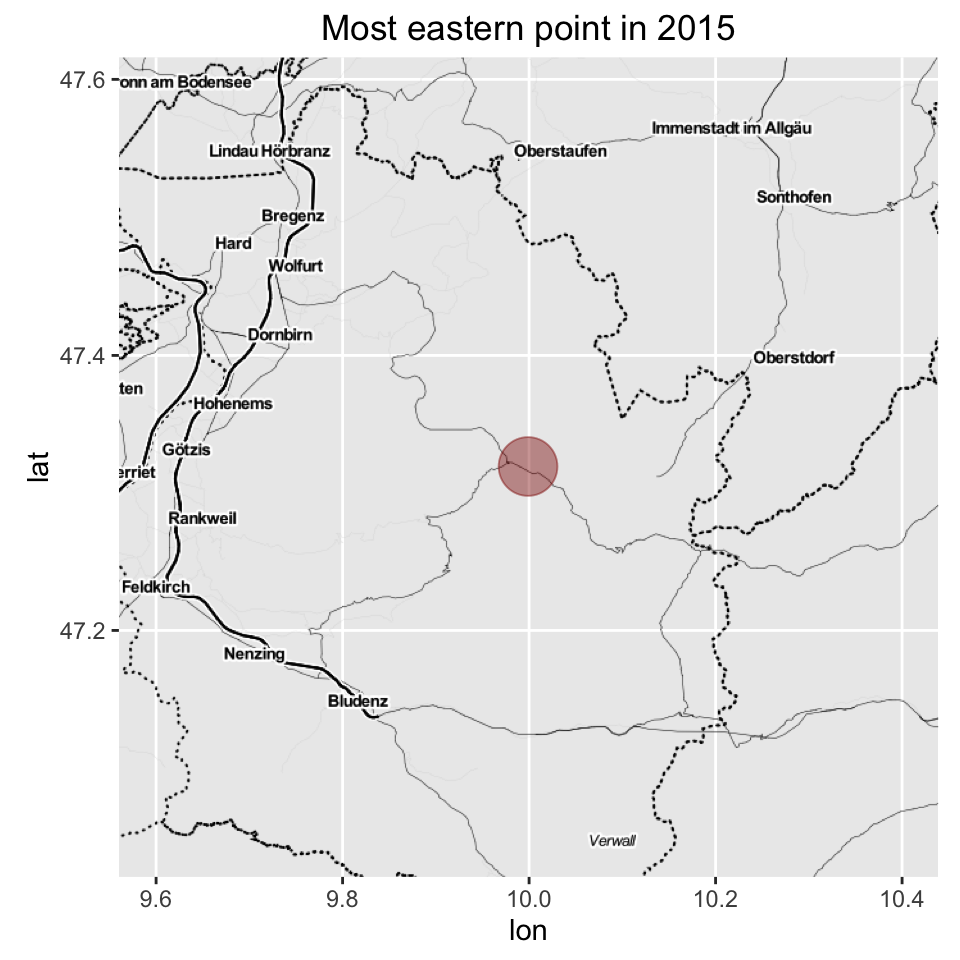
The most eastern point was in the Rehmen, during the first vacation with our (then) newborn daughter in the Bregenzer Wald.
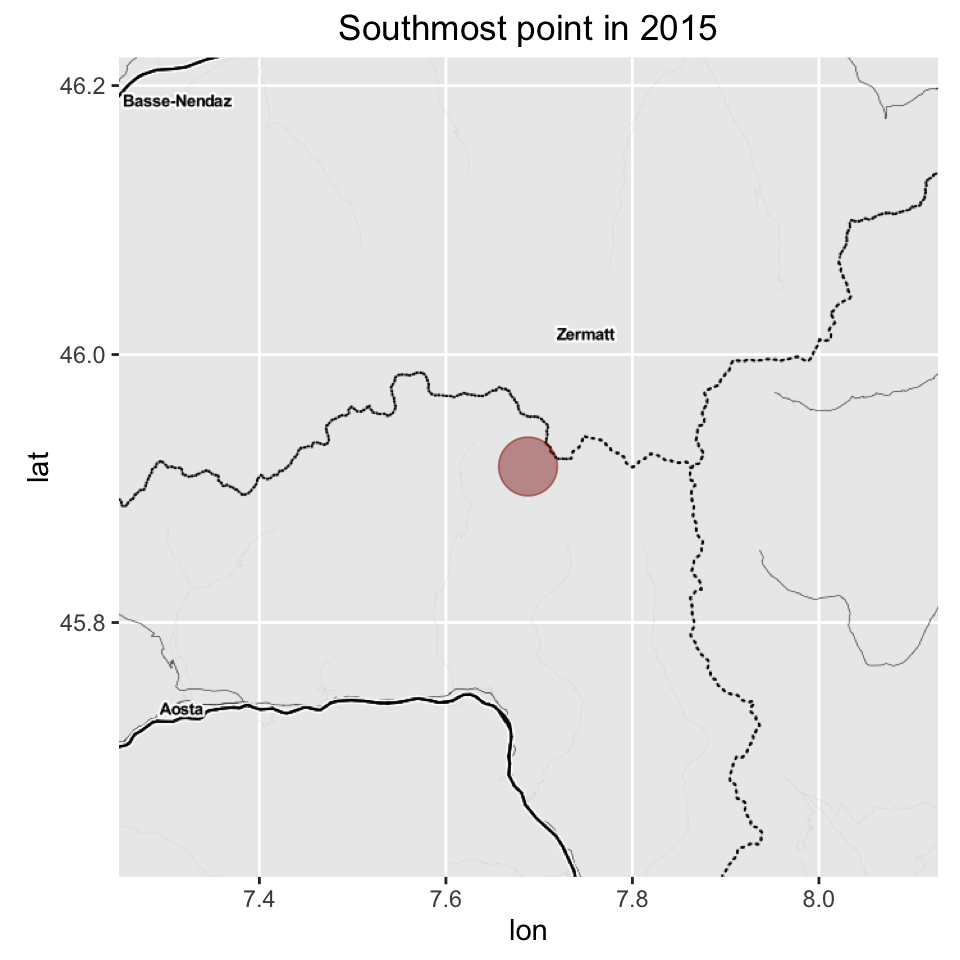
The most southern point was in Breuil, while skiing in Zermatt.
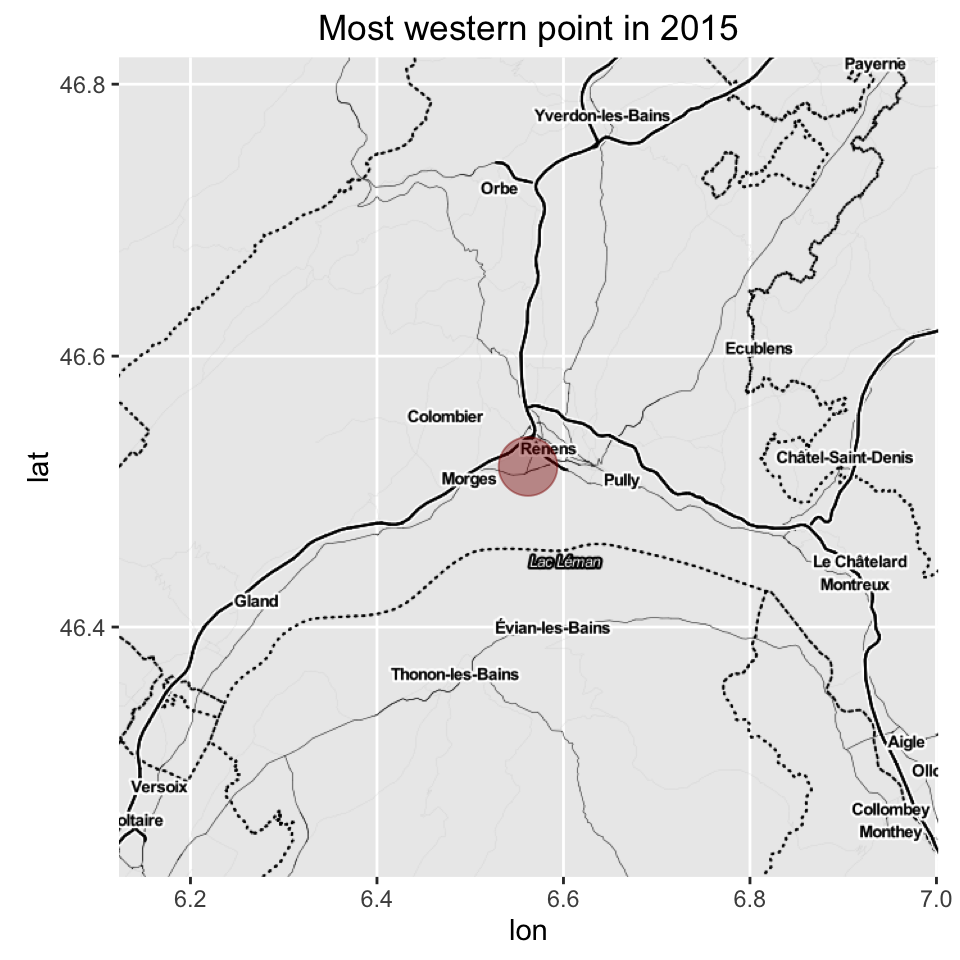
The most western point was in St-Sulpice VD, during a meeting at the EPFL in Lausanne for working on the GlobalDiagnostiX project.

The highest point in 2015 at 3399.9 m AMSL was close to Zermatt on the Furgsattel.
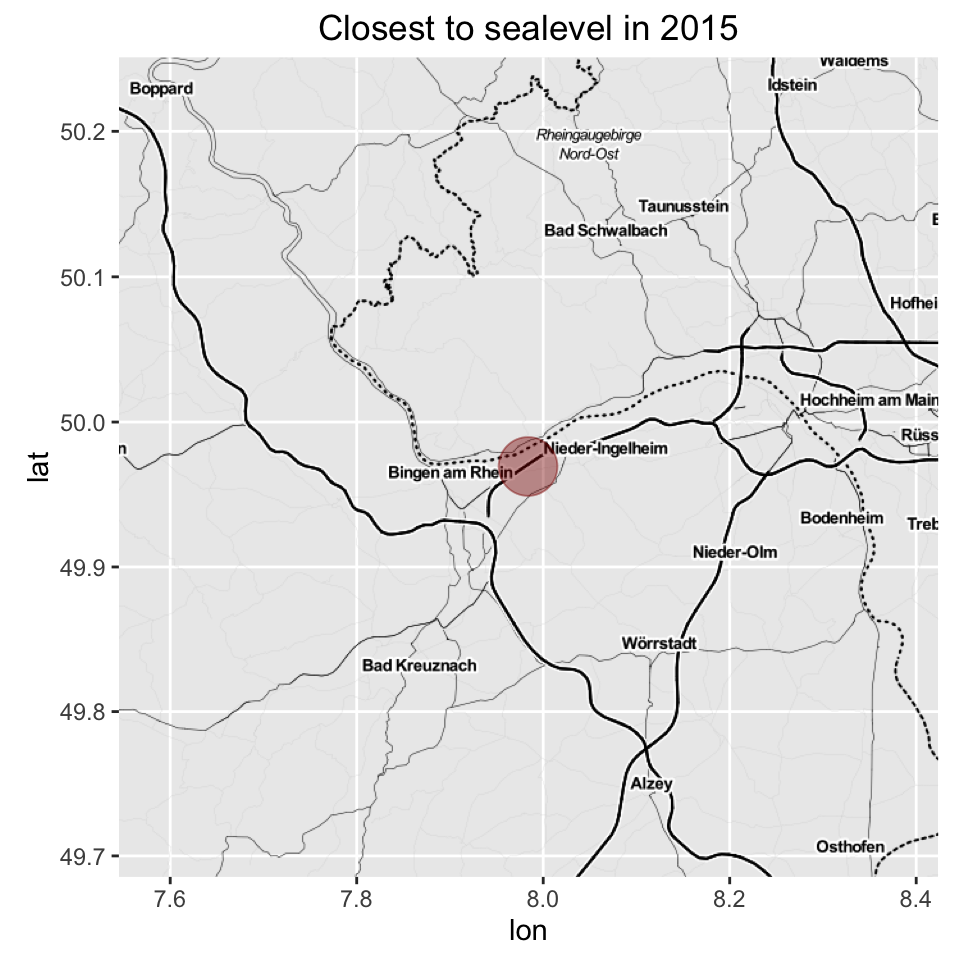
The lowest point at 84.8 m AMSL was in Gau-Algesheim, close to Ingelheim.
To plot the obtained data on a map, we have to center the resulting map location.
Since I only want to show the data points in Switzerland, we center the map on that.
Afterwards, we can simply plot all the thisyear geolocation points on top of that image, and you can see where I was in Switzerland in 2015.
HomeBase <- get_map(location= 'Switzerland', source = 'stamen', maptype='toner-hybrid', zoom=8)
AllPoints <- data.frame(lon=thisyear$lon, lat=thisyear$lat)
ggmap(HomeBase) + geom_point(aes(x = lon, y = lat),
                             data = AllPoints,
                             size = 3,
                             alpha = 0.125,
                             color="darkred") +
    ggtitle(paste("Where was Habi in Switzerland in", whichyear))

Hier ein weiterer meiner Jahresrückblick 2015-Posts. Die anderen sind unter dem Tag jahresrückblick15 zu finden.
Wie im 2014 habe ich mit der Everyday App praktisch jeden Tag ein Selfie von mir gemacht. Mit minimalsten Anpassungen hab’ ich das Skript von leztem Jahr über meine 338 Selfies laufen lassen. Zusammengesetzt mit der Zeitraffer-App kommt schlussendlich dieses Video hier raus.
Knapp die Hälfte der Tage dachte ich daran beim Arbeitsschluss im Treppenhaus ein Foto zu machen [2]. Dadurch ist der Hintergrund und die Beleuchtung in diesen Bildern etwas konstanter, was das Ganze etwas schöner zum anschauen macht.
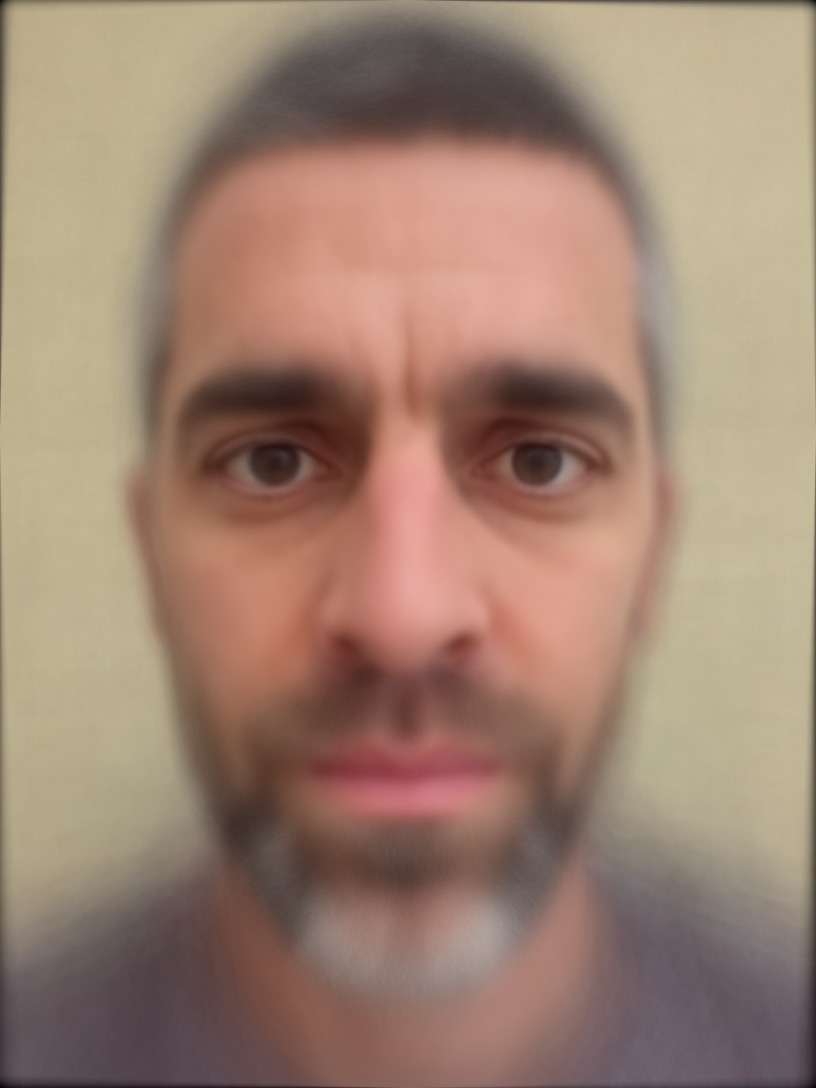
So seh’ ich aus, wenn mensch den Durchschnitt aus allen 338 ausgerichteten Bildern macht. Mein durchschnittliches Gesicht im 2015.
[1]: Oder war auswärts am arbeiten. Oder nicht am arbeiten.
Die Recommended readings kommen deutlich später als auch schon, weil mein Delicious curator-Plugin seine Dienste verweigert hat, bis ich heute dank Nerdcore.de herausgefunden habe, dass die del.icio.us-RSS-Feeds neuerdings von einer anderen URL kommen. Mit einem kleinen Umweg über Cyberduck ist delicious-curator.php schnell editiert und voila, weiter geht’s.
Im letzten Monat las ich folgende Texte und fand diese gut:
Im letzten Monat sah ich folgende Videos und fand diese gut:
Marc Mauricius Quambusch erzählt in knapp 45 Minuten über ein paar in Deutschland gängigen Verschwörungstheorien. Und spricht mit Reichsbürgern, Menschen welche an Chemtrails glauben und anderen SpinnernVerschwörungstheoretikern. Wem das zu lange ist, kann auch nur die kurze Sequenz nach gut einer halben Stunde anschauen.
Wie letzes Jahr versuche ich wieder ein-zwei-drei Rückblicke auf mein letztes Jahr zu machen. Die gesammelten Posts dazu werden unter dem Tag jahresrückblick15 gesammelt.
Hier ein Jahresrückblick in Fotos. Aus offensichtlichen Gründen ist meine Fotobibliothek in den letzten Monaten etwas monothematisch geworden; trotzdem sind ein auch genug andere schöne Momente zusammegekommen.
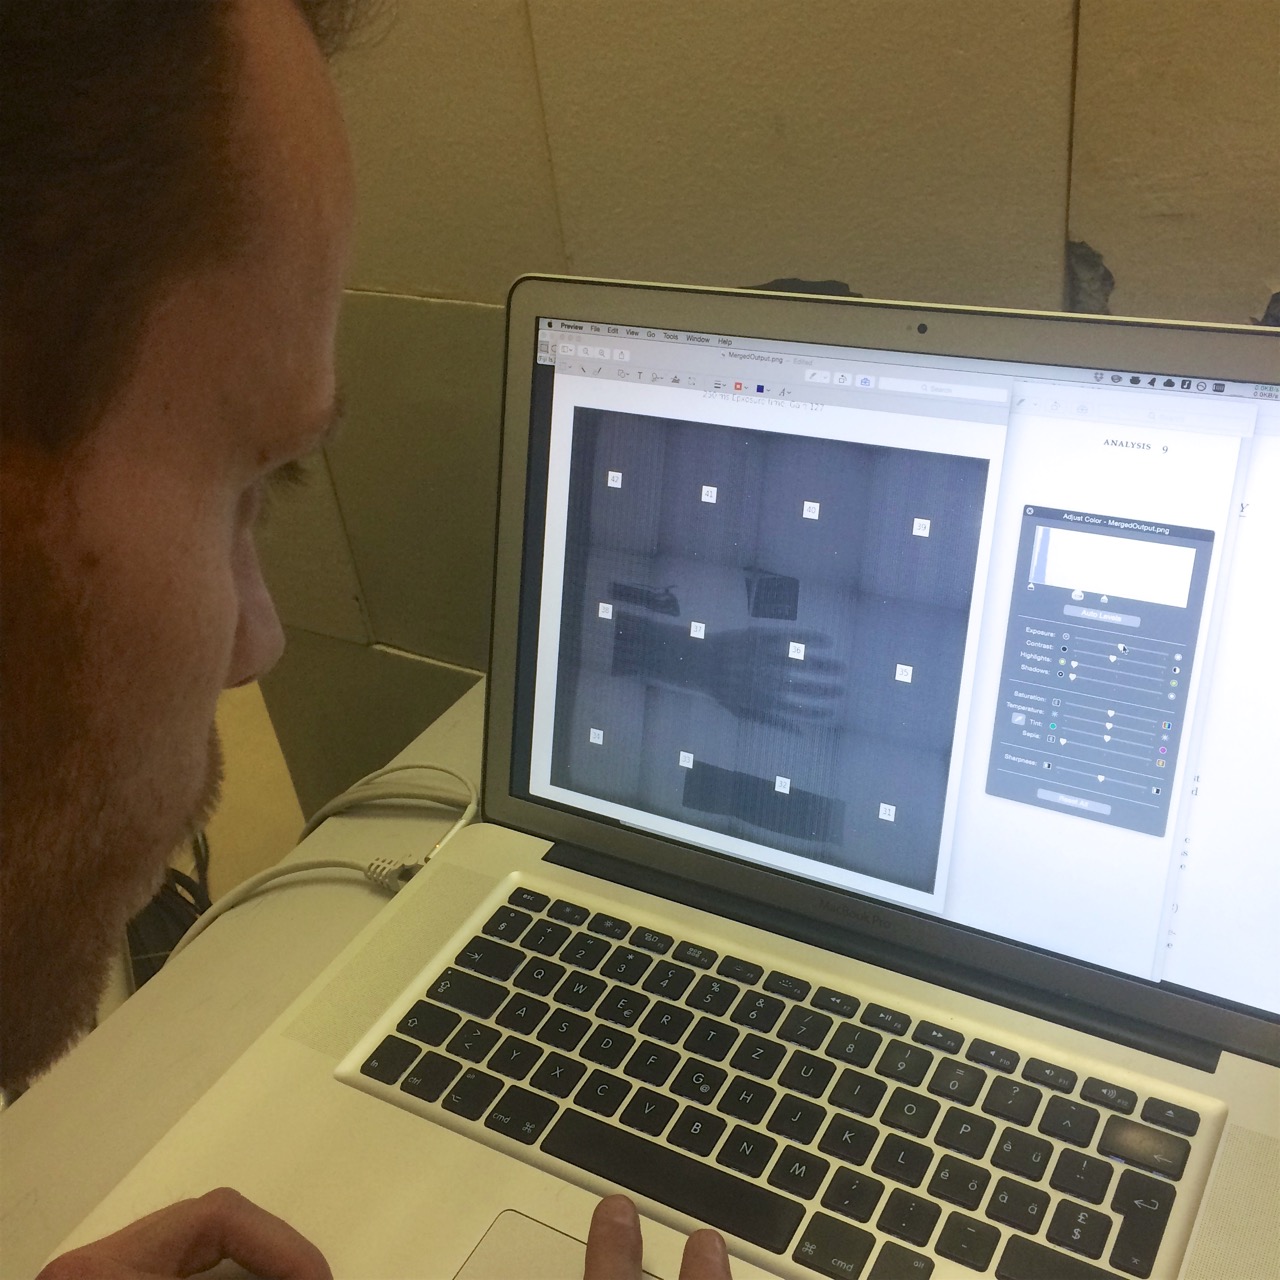
Januar: Das allererste Röntgenbild mit dem GlobalDiagnostiX-System, ein schöner Moment.
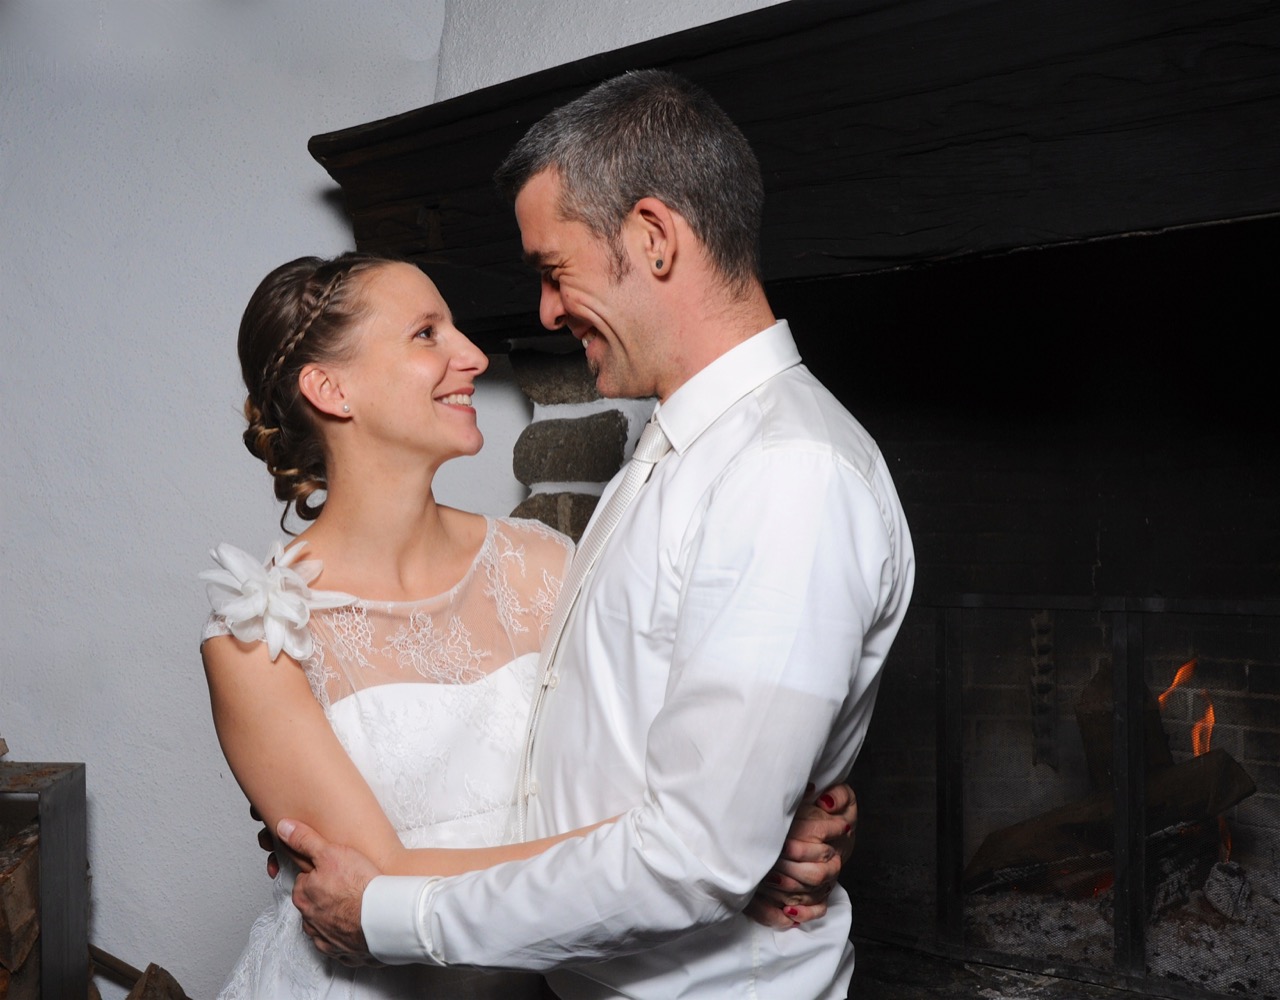
Februar: Den Fotomat für unsere Hochzeit zu mieten war eine der vielen guten Entscheidungen für diesen Tag. Die gut 1000 Fotos die entstanden sind, sind eine wunderbare Erinnerung.
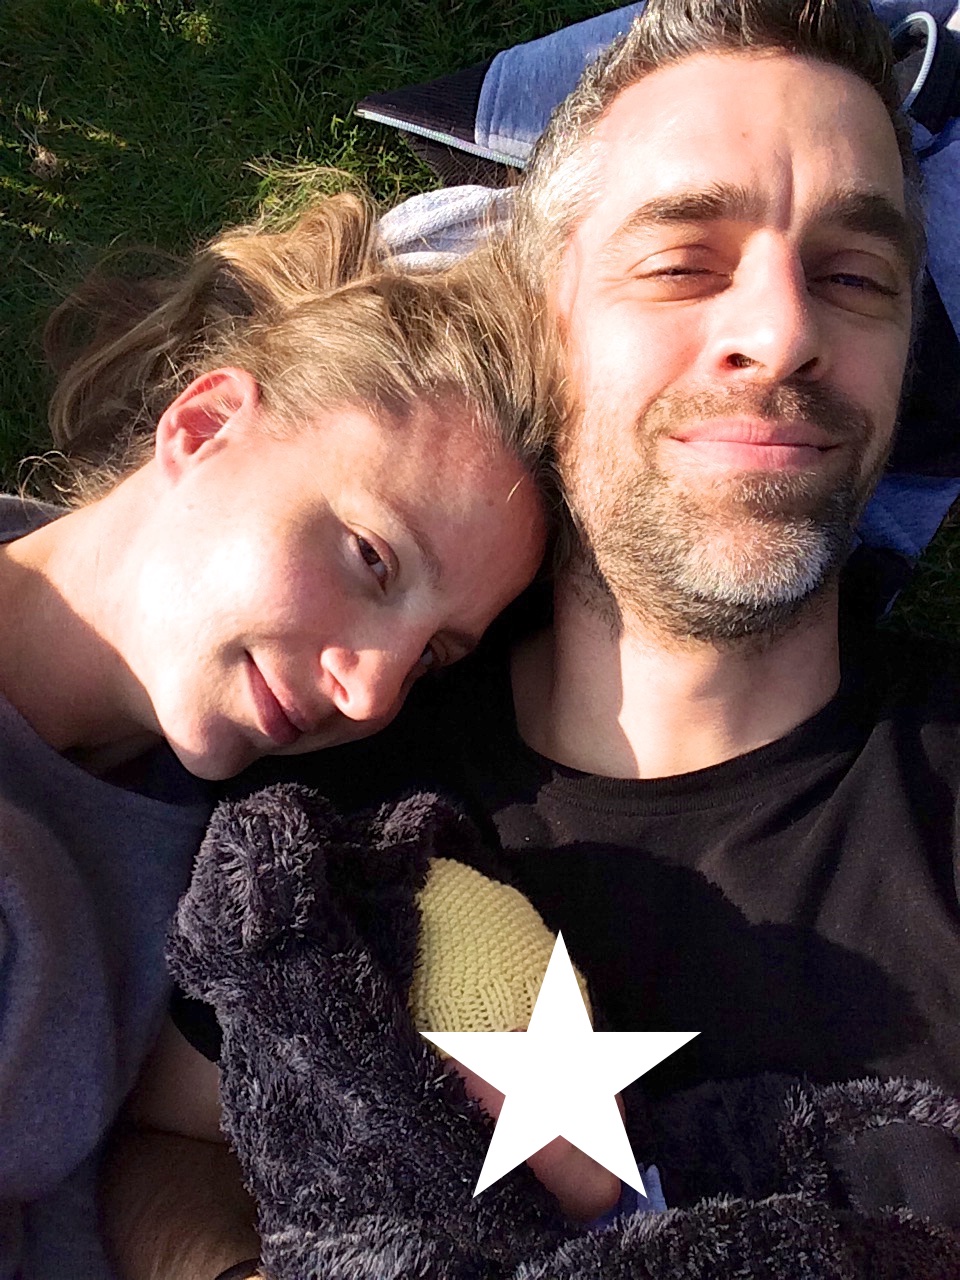
März: Aline ist da, wir geniessen die Sonne.
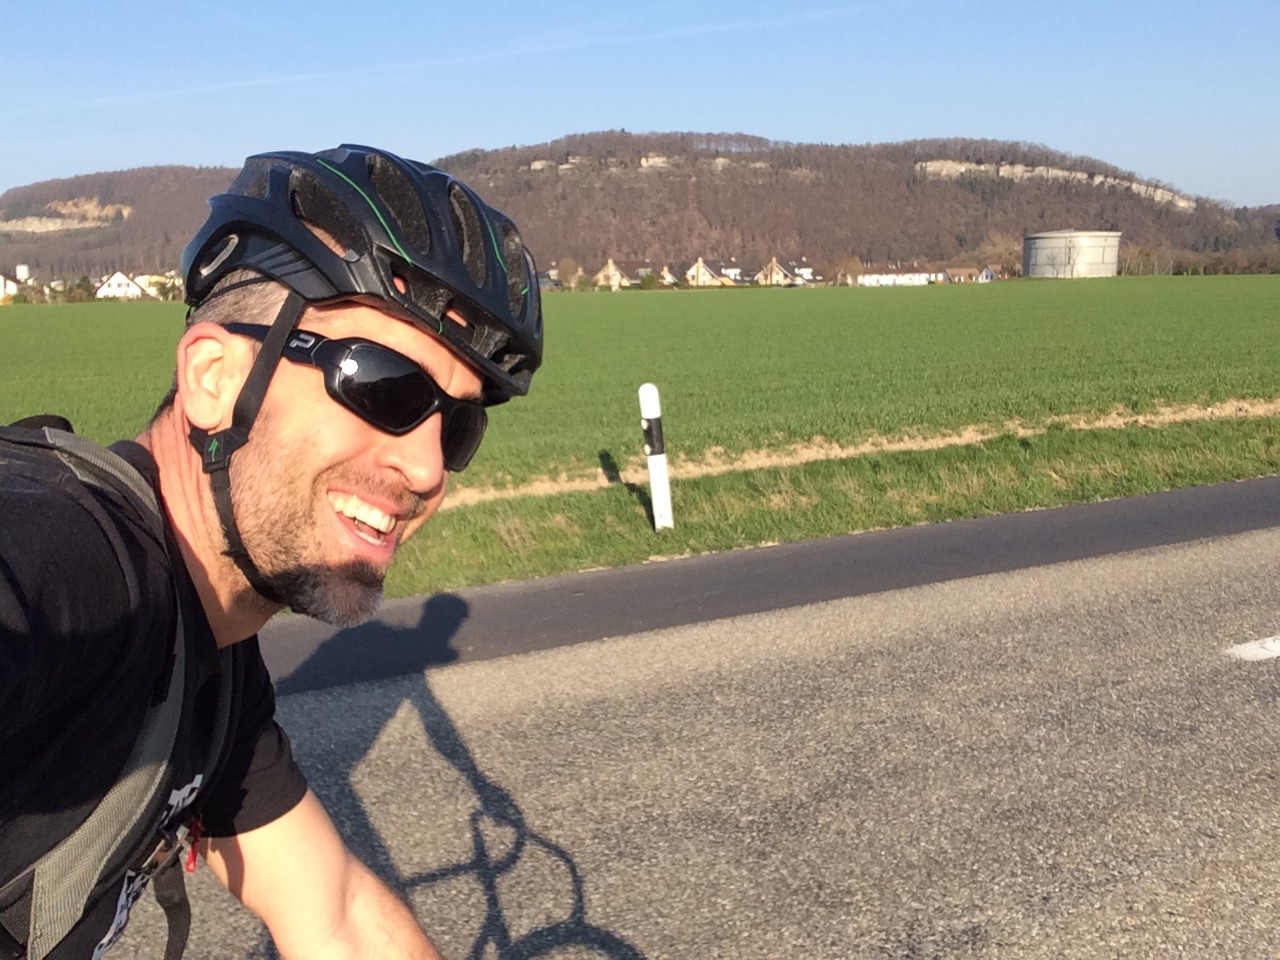
April: Der Vaterschafts-Urlaub ist vorbei, wenigstens scheint die Sonne auf dem Weg ins Büro.
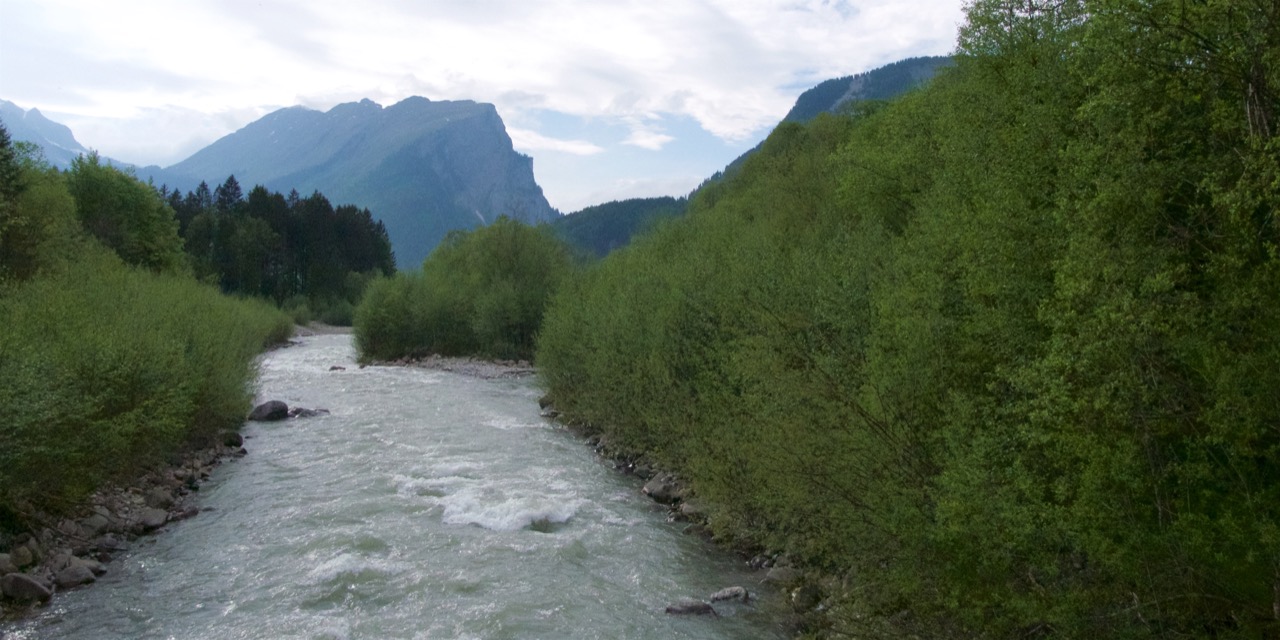
Mai: Zum ersten Mal im Ausland mit Aline. Im wunderhübschen Bregenzer Wald.
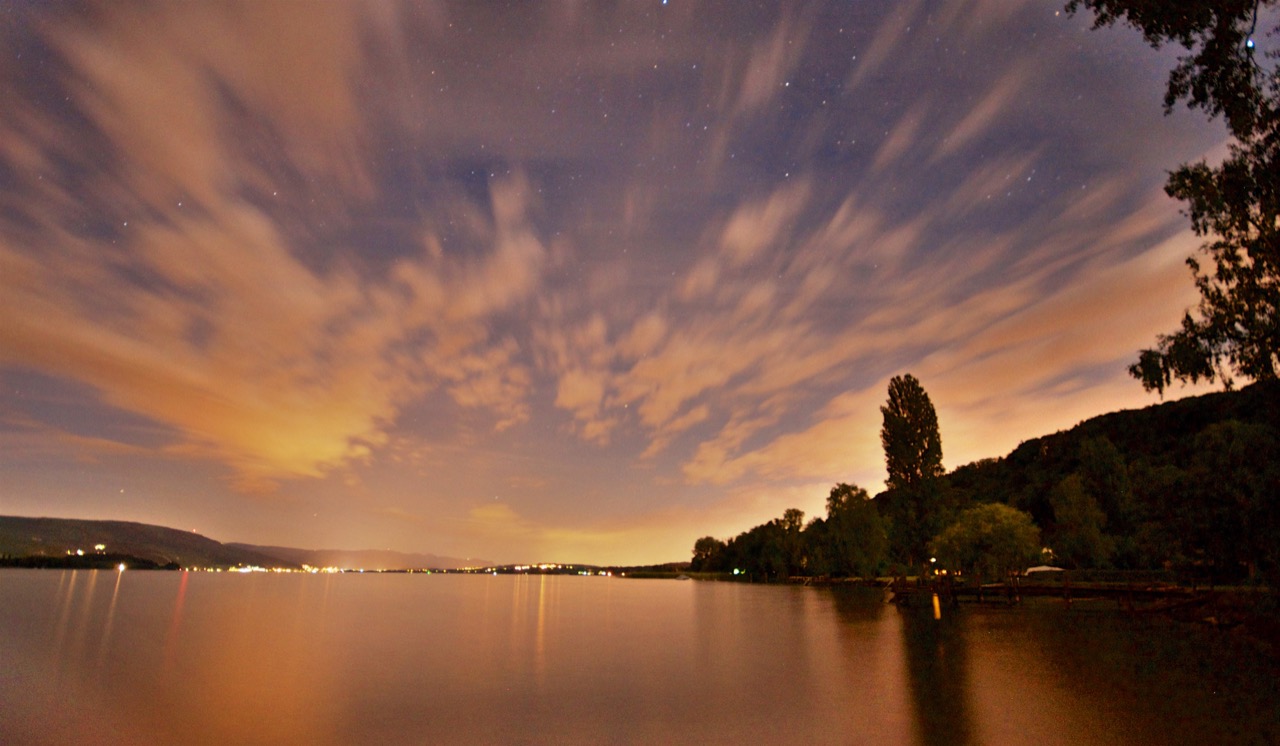
Juni: Ein super-schöner Tag mit Sommerfest am Bielersee geht mit einem ebenso super-schönen Sonnenuntergang zu Ende.
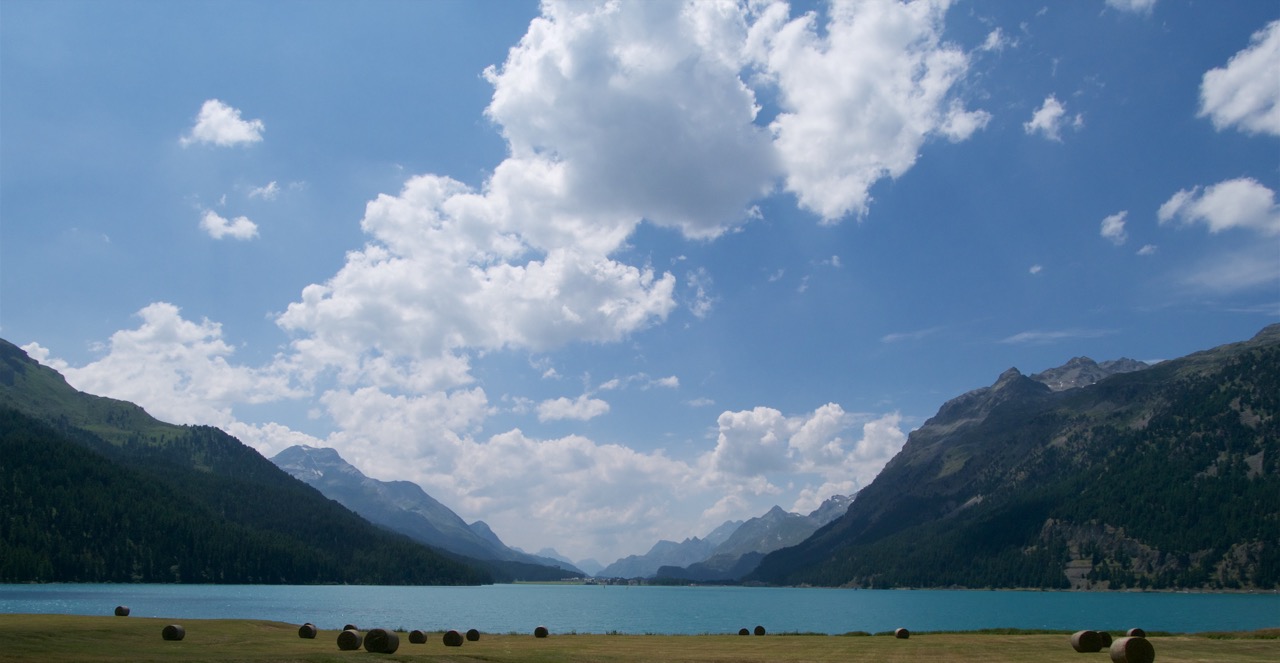
Juli: Die Ferien im Graubünden waren super, bis auf den letzten Abend. Das gehört aber nicht hierhin.
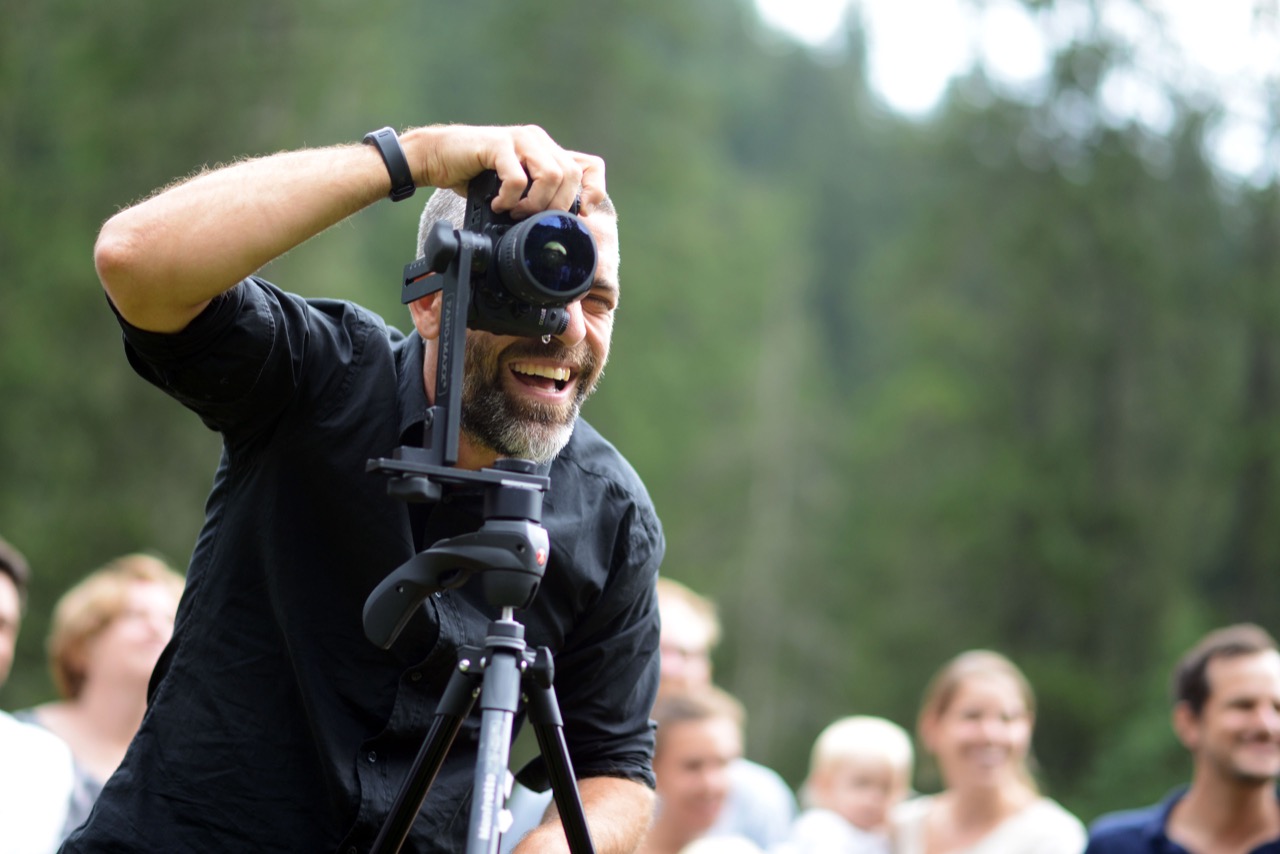
August: Ich mach’ das Hochzeitsgeschenk für Freunde. An ihrem wunderbaren Hochzeitsfest auf der Räzlialp.
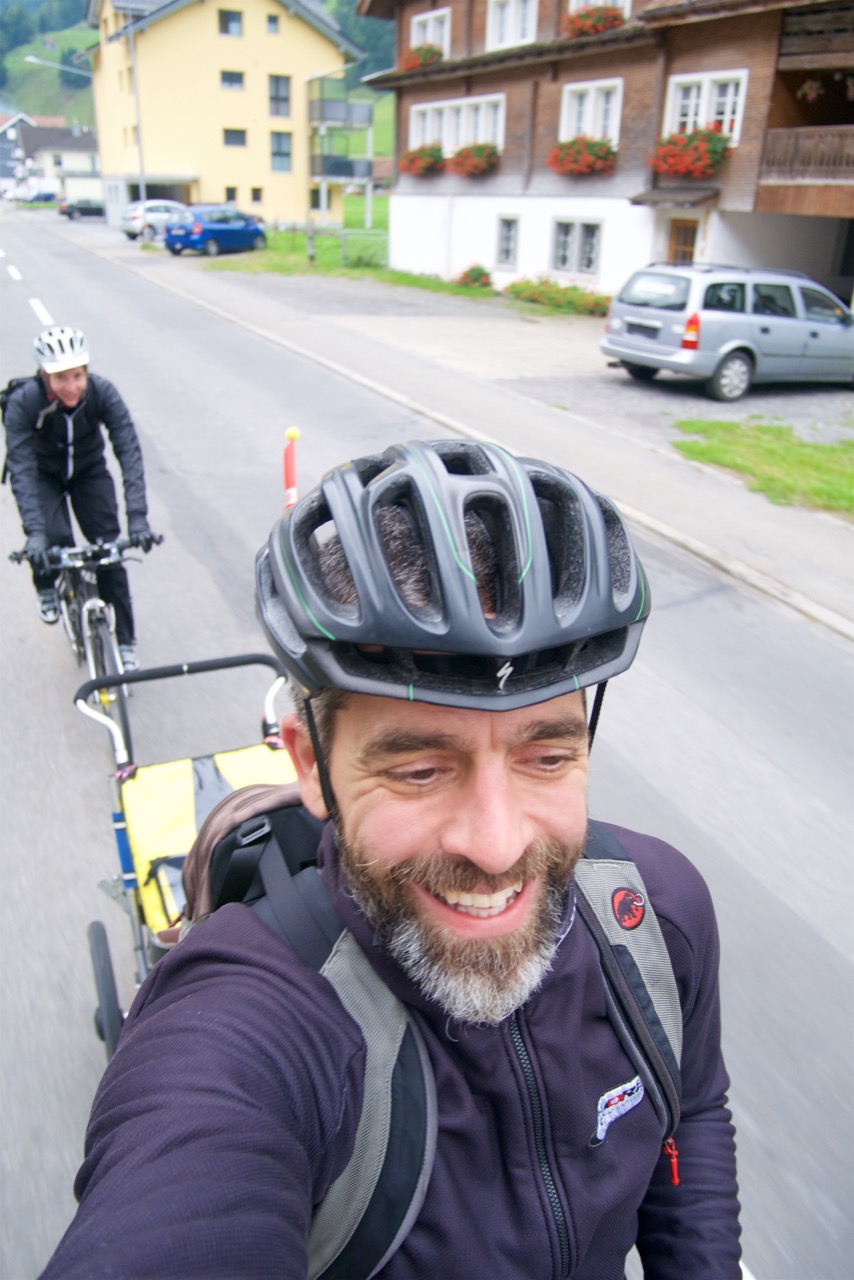
September: Hab’ ich euch schon mal erzählt wie super meine Frau ist? Sie ist nämlich bei solchen Ideen dabei. Mit einem Lächeln im Gesicht. Auch noch nach einer kühlen Abfahrt vom Pragel-Pass ins Muotathal.
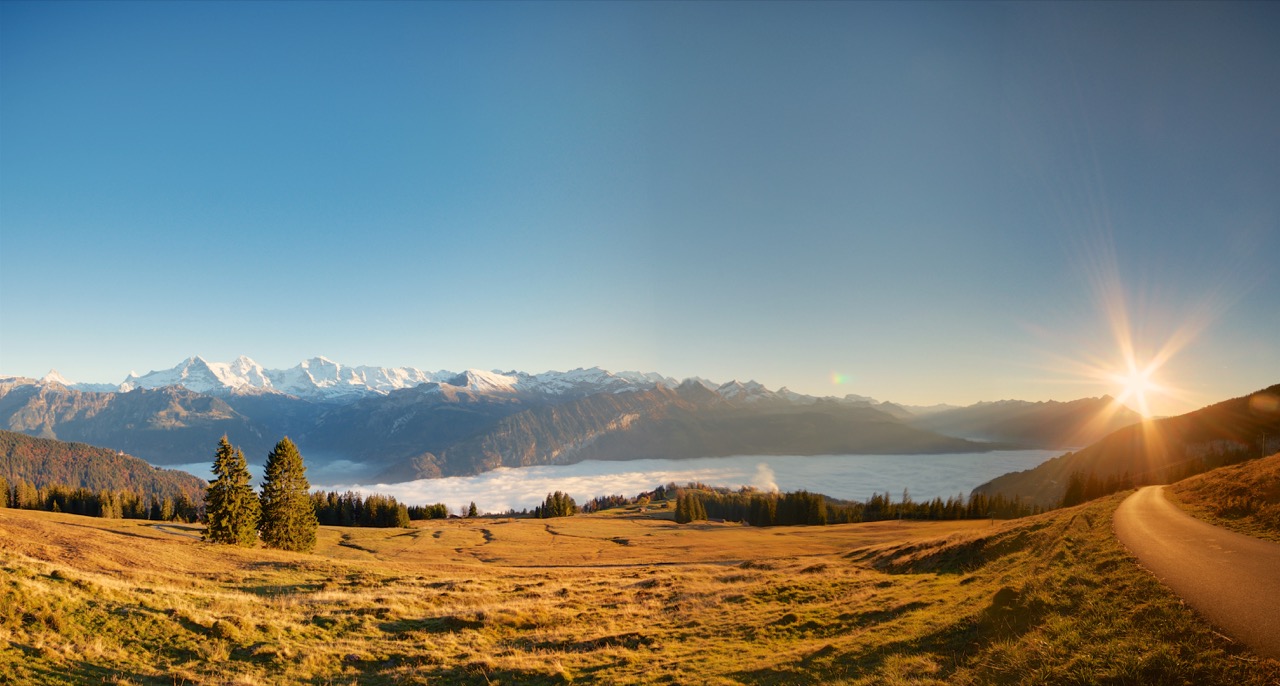
Oktober: Das Nebelmeer über dem Thunersee ist grandios. Die Wanderung vom Niederhorn runter geht übrigens auch mit dem Kinderwagen (auch wenn dieser zwischendurch getragen werden muss).
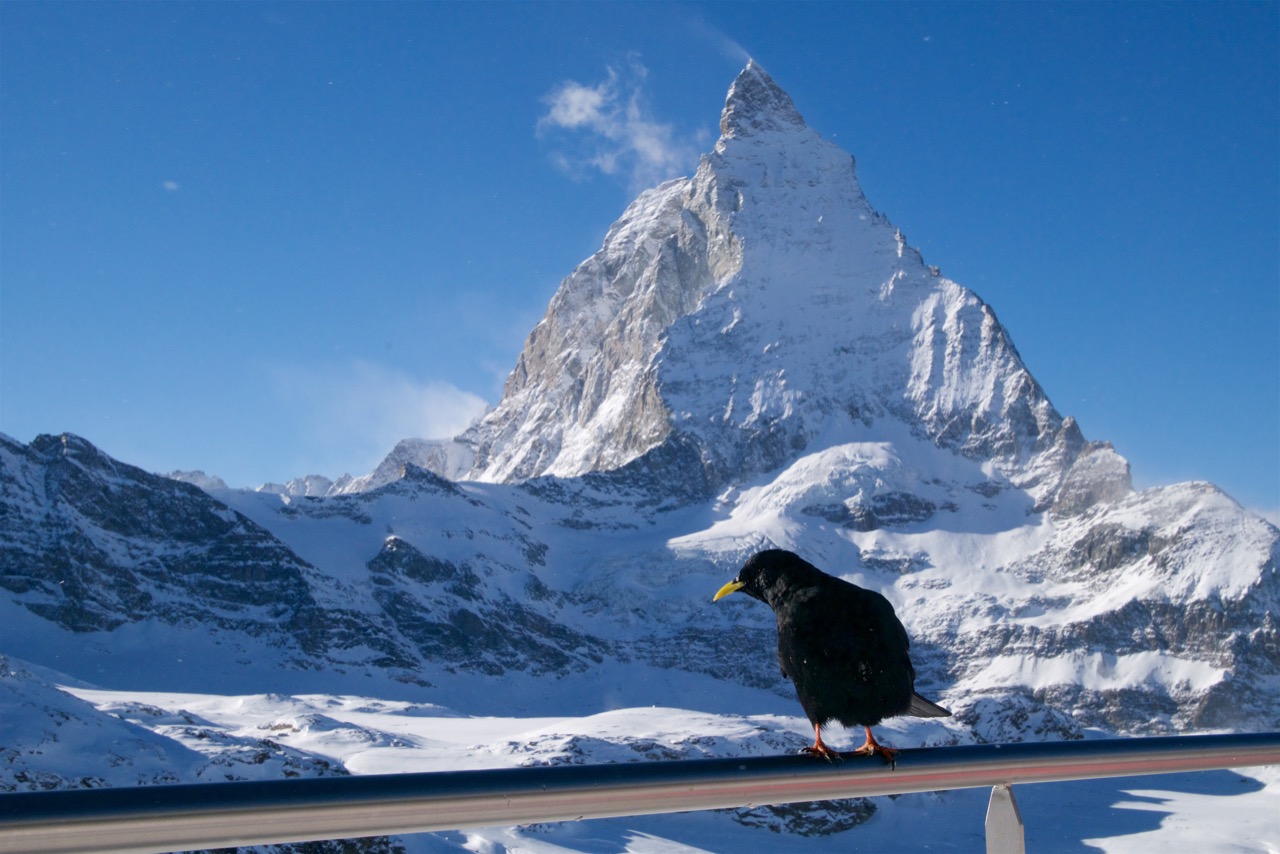
November: Die Skisaison ist eröffnet, wie immer im Penthouse des Haus Theodul. Mersi Mike für die Organisation.
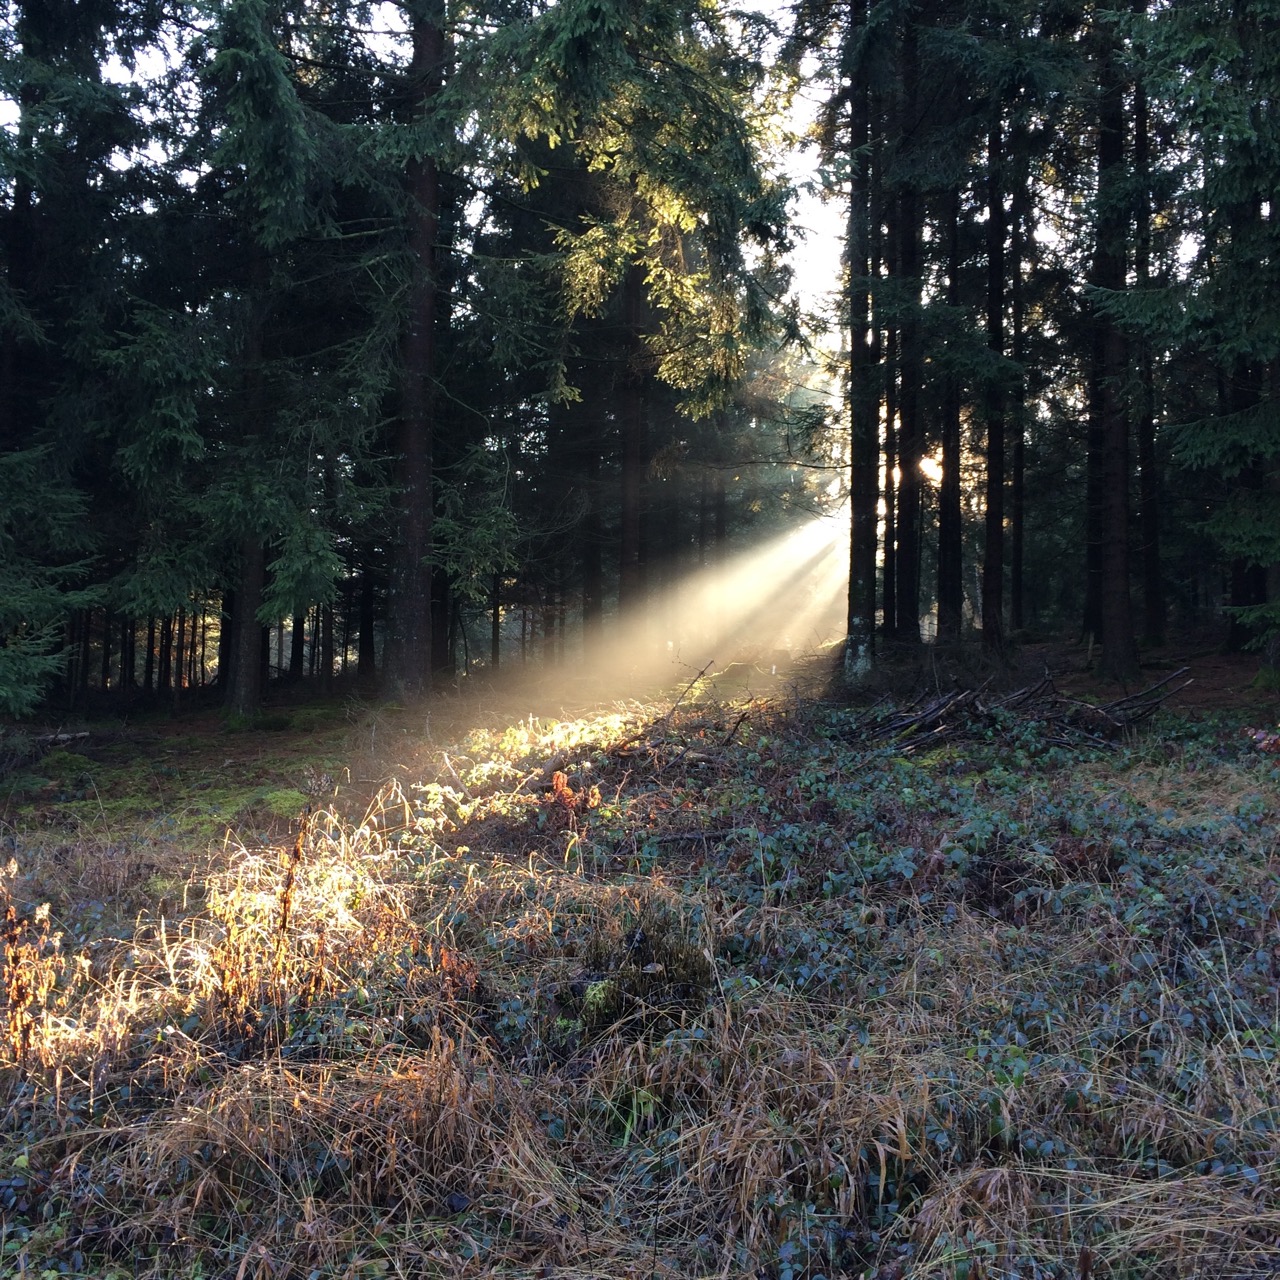
Dezember: Ein verspäteter Herbsttag mit warmem Licht im Könizbergwald.
PS: Habt ihr die Jahresrückblicke von Mark, Jan und Herr Blum auch gesehen?
Wie letztes Jahr, für die, die’s wunder nimmt. Das Making Of meines Neujahrskärtlis.
Zutaten:
Mise ein place:
Zubereitung:
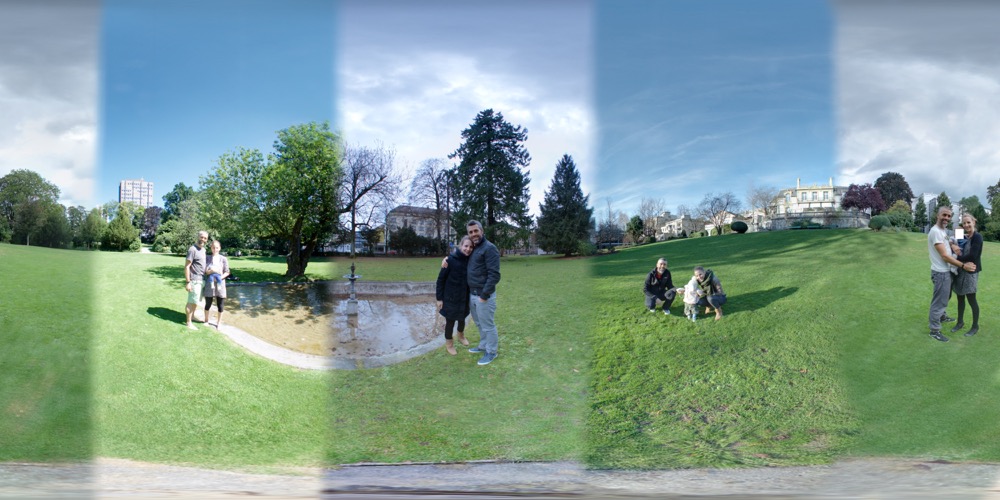
Äbe, es guets Nöis!
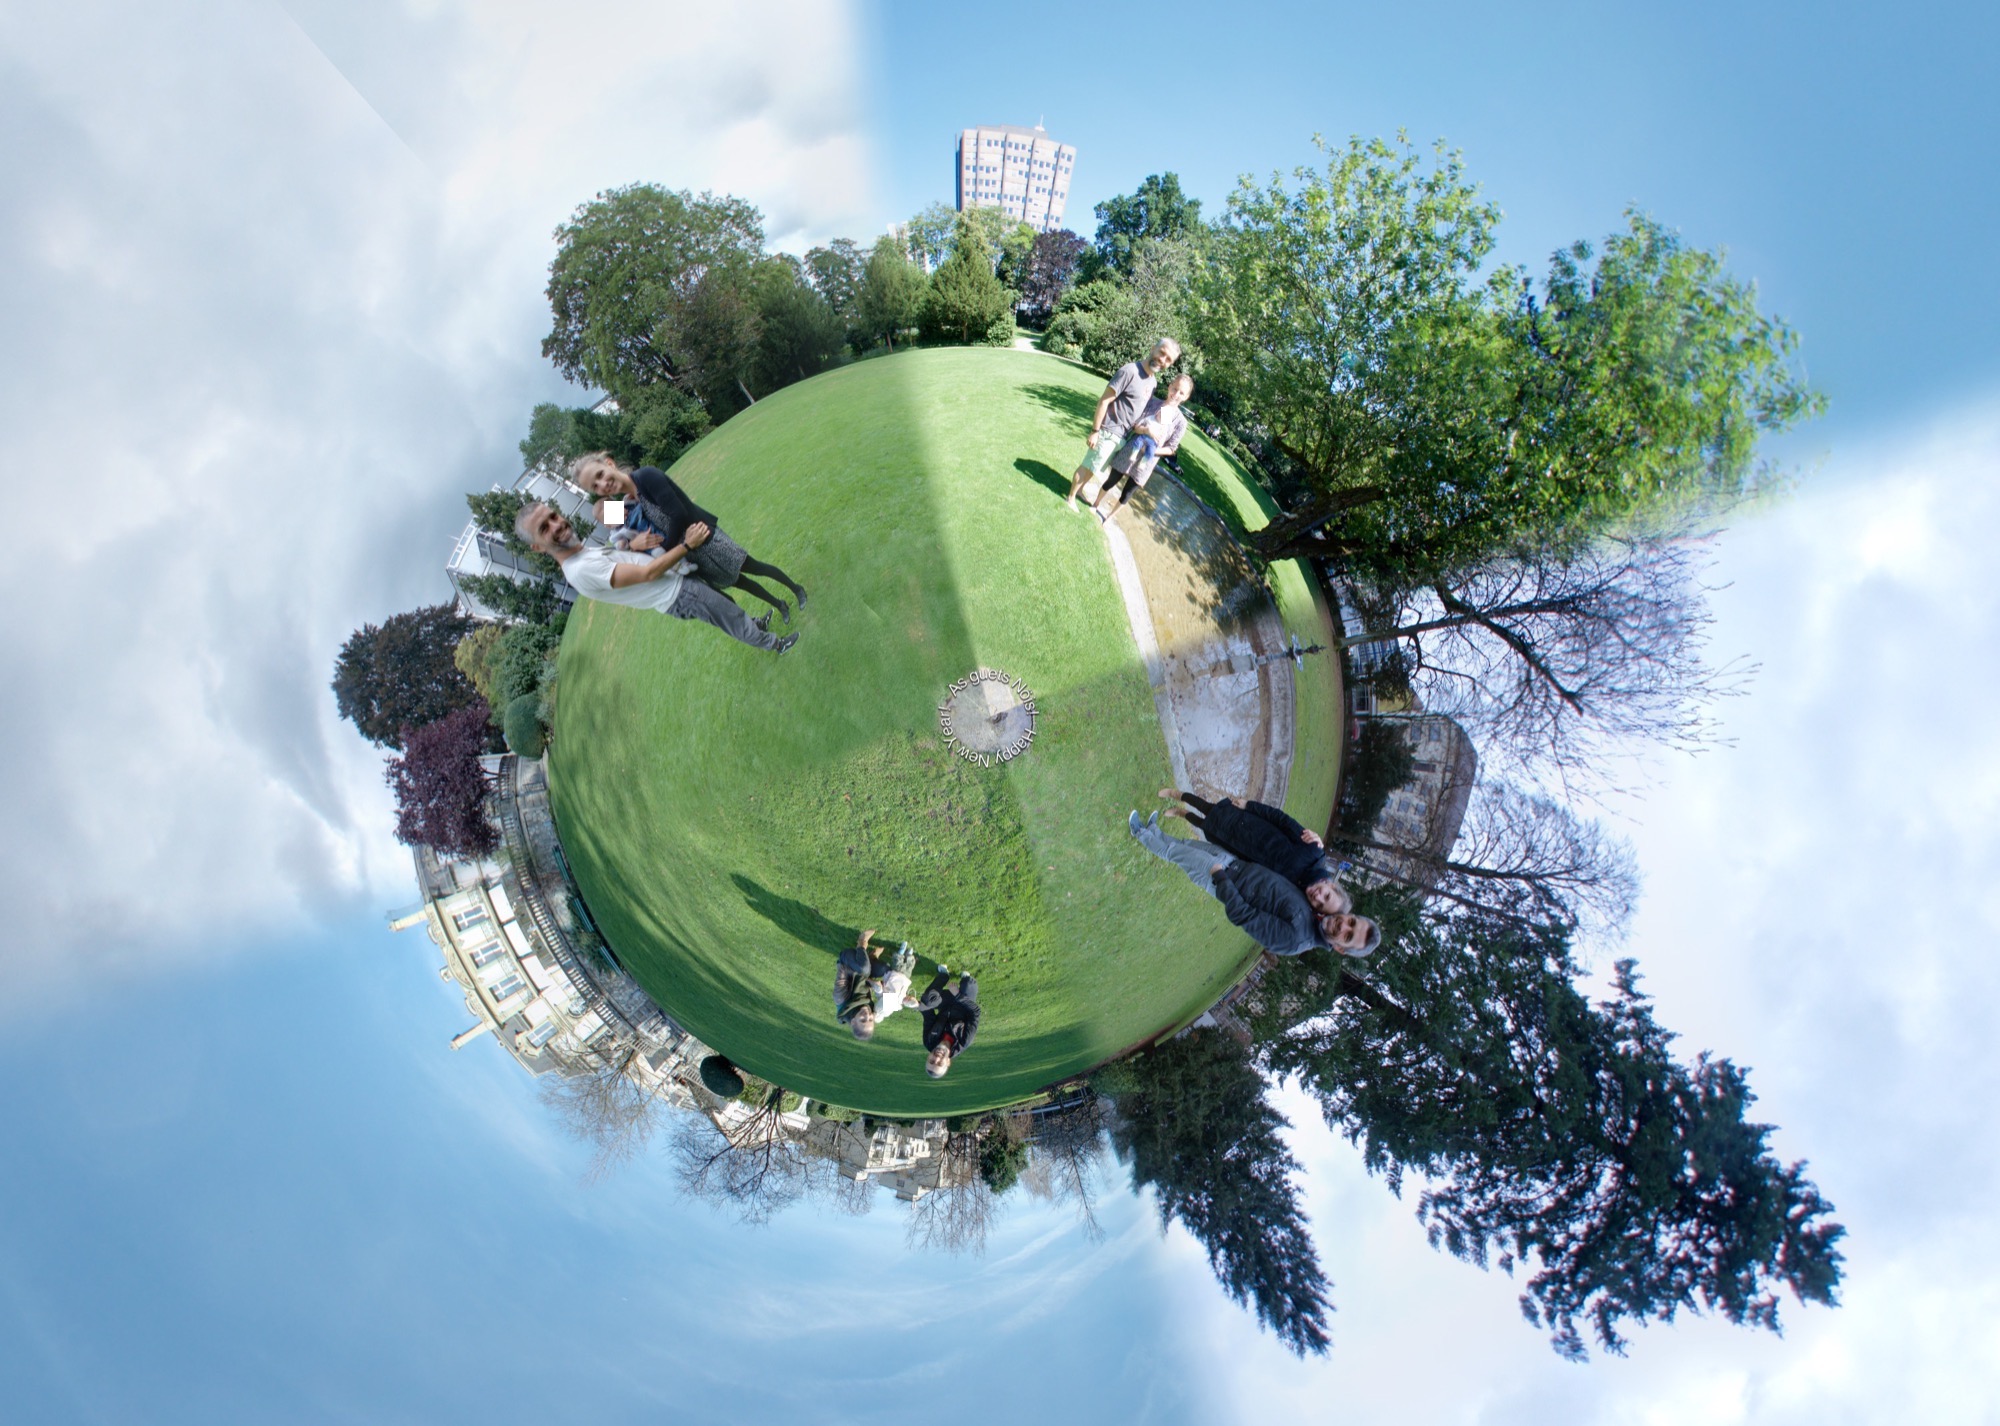
PS: Wer in das Panorama eintauchen will, kann das unten tun. Und wie immer, Aline hat schon ein Gesicht, einfach nicht überall im Internet :)