
is this a known problem for other iphone-owning readers of my blog?
iTunes tells me that there are updates for iPhone applications, I click on the “check for updates”-button and iTunes tells me – sometimes twice – that updates for my programs are available. i thus have to click multiple times to see the updates of which I already know that they’re available… quite annoying, don’t you think? does one of my readers have the same problem and even knows a resolution? I’d like to hear your tips.
a short screencast describing the problem can be seen below:
oh, and this post is also a test of jing :)
April 2009
danny macaskill, inspiration [video] [with map]
einer um gut in den tag zu starten: der stunt bei ca. 3:15 ist unglaublich!
[via milano fixed]
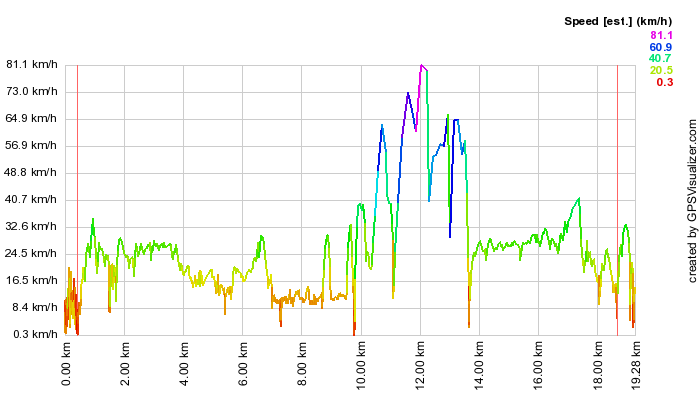
da fühle ich mich mit meinen knapp 20 km ein bisschen hoch- und runterfahren am feierabend grad langweilig, auch wenn ich’s laut gps-tracker auf 81 km/h höchstgeschwindigkeit gebracht habe. der track ist unten zu sehen, das geschwindigkeits-profil ganz unten.
nachtrag zum gp I: finisherclip [video]
genau wie christian wollte ich auch noch meinen finisher-clip zum besten geben. ungefähr in der mitte des clips, im blauen tshirt, kurz vor demjnigen im schwarz-weissen, der nach zieldurchlauf die arme hochreisst. im ziel weniger sportlich unterwegs als christian, aber trotzdem glücklich :)
falls der clip oben nicht sichtbar ist, kann mensch auch hier klicken, ums anzuschauen (übrigens: schöne URLs, bravo!)
bravo habi, dan und christian!

Ich nehm’ mir vor, nächstes Jahr mehr als vier Mal zu joggen vor dem
Grand Prix; nicht damit ich schneller bin, sondern damit ich weniger
leide…
Ach und ja; einem Freund helfen zu zügeln am morgen war wohl auch
nicht die ideale Vorbereitung.
panoramas from (low quality) movies [update]
whenever i’m spending a day outdoor, i love to take pictures, many of them turn out to be panoramas.
sometimes i leave my camera at home and only have my mobile phone with me. shoothing panoramas with the iphone is possible with panolab [link opens itunes], but very cumbersome. and i try to keep the annoyance of nina as low as possible while stopping on the slopes, so fiddling with my phone for longer than a minute or two is not an option.
recently i was thinking about a quick-and-dirty way of creating panorams with the iphone: wouldn’t it be possible to extract the images of a movie shot while panning the scenery and stitch those together to generate a panorama? today was the perfect way to test this out, on the slopes of the wonderful stockhorn.
the whole process is fairly easy, you only need
- an iphone, jailbroken (or any other movie source :) ) with cycoder installed
- cyberduck or winscp, depending on your platform
- imageJ and
- hugin
all these – very fine – pieces of software are freely available, most of them even free as in beer and as in speech.
step 1:
shoot a movie.
below are the movies i’ve used for this tutorial. both are made with the excellent cycoder.app, only for jailbroken iphones. use any other movie if you don’t have an iphone :) the movies are 384×288 pixels in size, as shown below, just press the play-button.
step 2:
get the movies off your iphone.
cyberduck and SFTP are my weapons of choice, YMMV, but there are tons of tutorials on the web, here’s one for the mac and here’s one for windows.
now you should have some movies on your hard-disk. cycoder has the nice feature to produce quicktime-compatible .mov-files, if you don’t have one of those handy, again, YMMV. (use the excellent handbrake to convert to and fro). quicktime is nice for the next step.
step 3:
import the movies into imageJ.
if you’re on a mac, this is just simple drag-and-drop, on windows you might be quicker altogether if you convert your movies to .avi-files, since installing quicktime for java can be a bit of a hassle, but can be done.
this opens your quicktime movie as a stack of images you can then scroll through. this image-stack can then easily be exported as an image-sequence using “File > Save as > Image Sequence…”. rotate the images if you’ve been dumb enough to hold the iphone wrong :)
then you’ll have a bunch of single images on your harddisk. if you’ve panned quite slowly like i have done, you’re probably gonna have much too many images (167 for the first and 139 for the second movie) to easily stich a panorama. for these movies, i’ve removed some images from the stack using the slice remover plugin. remove slices that are unnecessary like the ones at the beginning and the end, where your glove covers the lens. now having 20 and 32 images from both movies, proceed to the next step.
step 4:
import the images from the step above into hugin, align and stitch.
yes, that’s it, it’s really that easy. for the movies shown above i’ve also deleted some bad control points and stitched the panoramas normally and enfused, but this is entirely optional.the end-result looks like the images below. click them to see them bigger.
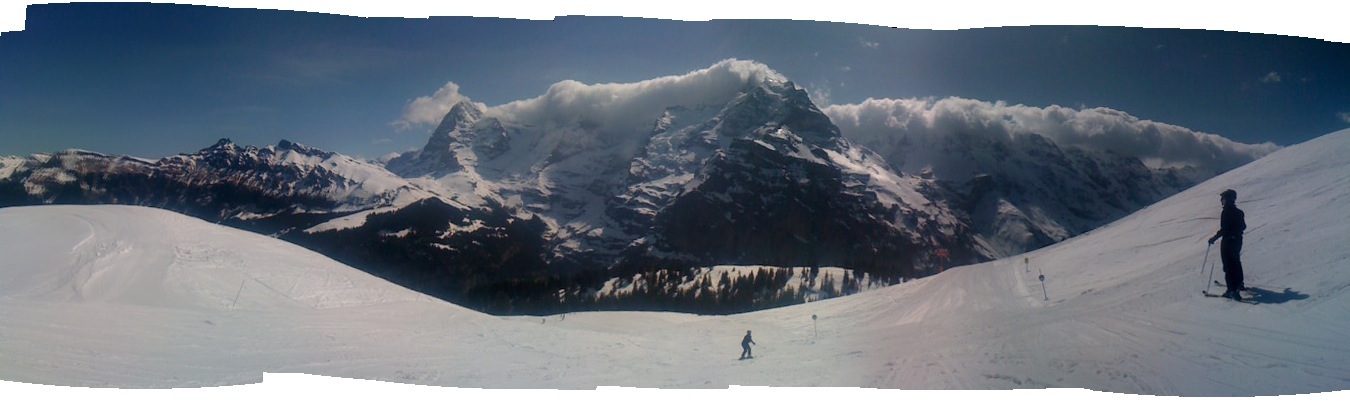
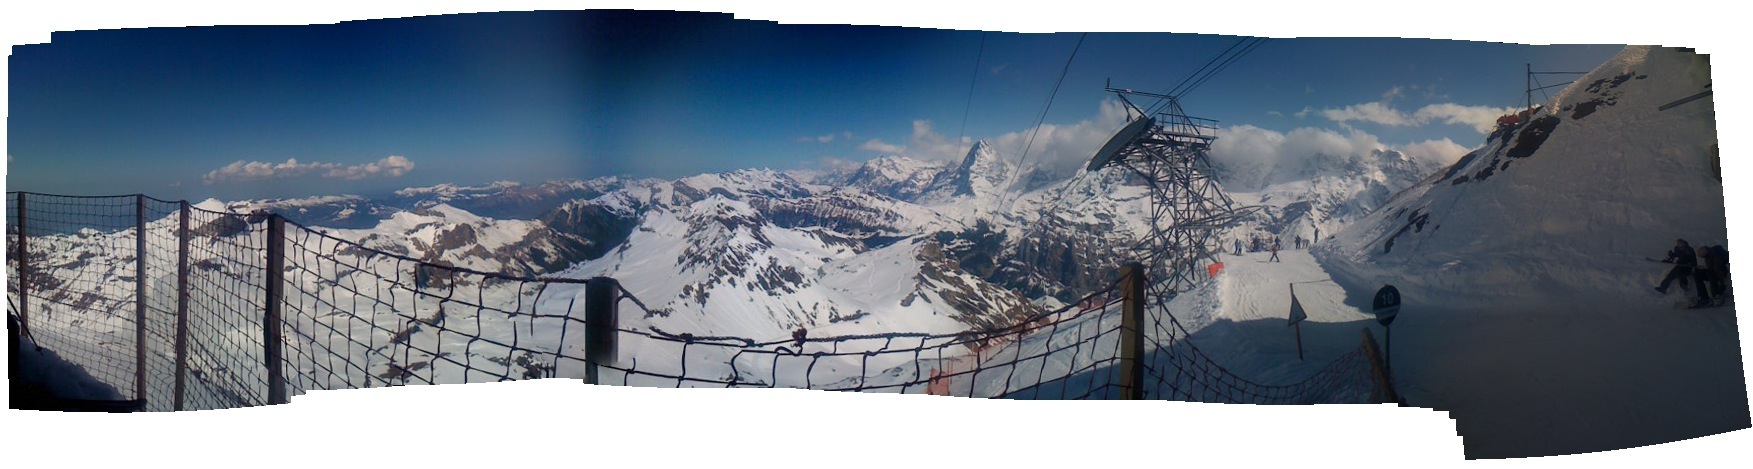
i know that both panoramas are not perfect. both are quite small, especially the second one has some artifacts and both have varying exposure. but keep in mind that i’ve only bothered nina for 29 seconds, the total time of both movies. not too shabby!
update:
arru from sweden left a comment about extracting the frames of videos using VLC, which is great, because it plays pretty much any movie-format.
since i couldn’t find it, i asked him to outline it for me via email. he agreed that i share his howto, which you can find below:
Extract frames in VLC:
- Open VLC preferences, select “all” (as opposed to “basic”)
- Go to Video->Output modules
- Select ‘Image video output’ (this must be reverted to ‘standard’ when you’re done, to use VLC as a normal video player again)
- Flip down the subgroup next to Output modules and select ‘Image file’
- Choose ‘PNG’ as format (JPEG works too, but there will be some unnecessary quality loss)
- Set ‘recording ratio’ to 10 (determines the number of video frames skipped between images – may need to experiment with this value if images don’t overlap correctly)
- Press ‘save’ to exit VLC preferences
- Open and play the video in question as you normally would (notice: there will be no picture – sound however, if applicable, and the VLC controls will move to show you the progress of the conversion)
- Images are saved to the root of the main HDD on Mac OS X ( / ), on Windows I can only assume it will be C:
- Don’t forget to reset step 2 to ‘Standard’ when you’re done
- Throw images into Hugin and run one of the autopano scripts, and so forth
Thanks for that info, Arru!
der wohl letzte skitag der [with map]
bei den temperaturen heute war auch auf dem stockhorn nicht mehr allzuguter schnee, nichtsdestotrotz war’s ein wunderbarer tag und ein gelungener abschluss der ski-saison (sehr wahrscheinlich)
mit freier software freie software-daten visualisieren [update]
seit einen halben jahr beantworte ich die frage “what’s up?” nicht bei twitter, sondern der quell-offenen alternative, bei identi.ca [1]. über die beweggründe, eine offene alternative zum fail whale zu benutzen soll hier nicht die rede sein [2].
in den letzten tagen hab’ ich mich gefragt, wie schnell identi.ca wächst. jedes status-update wird bei identi.ca als wachsende nummer, in der form http://identi.ca/notice/1 [3]. jede dieser nachrichten wird dann mit einer klar definierten zeit auf der webseite festgehalten. aufgrund der beiden parameter nummer und zeit könnte schon ein kleiner graph entstehen.
da es mir aber äusserst mühsam erschien, genug status updates anzusurfen, die jeweiligen zeiten aufzuschreiben, dies in eine excel-tabelle [4] einzutragen und dann einen plot zu generieren, habe ich mich nach kurzer überlegung entschieden, das ganze anders anzugehen: mit einem kleinen python-skript (siehe hier) lade ich eine definierte nummer von sogenannten dents, mache eine kleine aufhübschung mit ein bisschen text-ersetzung und schreibe das ganze in ein komma-separiertes textfile.
in diesem textfile landen alle parameter, die für einen plot notwendig sind. nach weitere kleinerer rumbastelei landet das ganze in 23 zeilen LaTeX-code (siehe hier), mit dem dann mit der hilfe von tikz und pgfplots untenstehende graphik entsteht [5]. die rumbastelei hat vor allem mit der anpassung von zeitspannen zu tun, damit’s ein schöner plot wird.
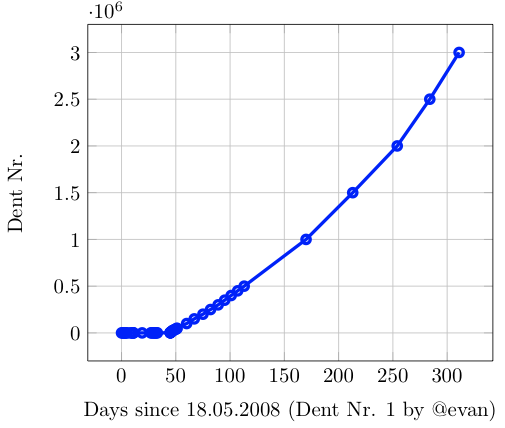
im ganzen plot sind nur 55 datenpunkte verwurstet, aber nichtsdestotrotz kann mann einen eher exponentiellen anstieg der anzahl nachrichten in den ersten 300 tage identi.ca feststellen. damit der plot aussagekräftiger wird, muss ich mein python-skript mal etwas länger laufen lassen, oder jemand interessiert sich wirklich so fest dafür, dass er es mit meiner vorlage weiterführt oder verbessert.
dieser post soll auch dazu dienen, dass ich – nach dem blgmndybrn special im musigbistrot – grad noch bastian einen richtigen hinweis auf identi.ca und LaTex geben kann: bastian, identi.ca ist oben abgehandelt, meine code-schnipsel zu LaTeX landen hier, diejenigen zur bildverarbeitung mit imagemagick hier. weiter wollte this noch auf das schöne paket hingewiesen werden, mit dem mann – mit 23 zeilen code – solche plots wie oben stehend generieren kann. eben, pgfplots und mein beispiel an LaTeX-code.
also, wenn ich für die ausrechnung der tage seit dem start nicht doch gestern abend numbers verwendet hätte, würde auch der titel dieses eintrages stimmen, mit python habe ich die frei verfügbaren daten von identi.ca geladen, in ein text-file geschrieben und mit dem übermächtigen LaTeX daraus ein kleines, aber feines pdf erstellt.
und ja, ich geb’s zu, ich bin ein nerd!
[1]: seit längerer zeit wird auch mein status beim moloch facebook von identi.ca aus aktualisiert
[2]: “my data”, “my content”, portabilität, freie meinungsäusserung, etc.
[3]: hier das erste status-update von evan, dem kopf hinter dem ganzen
[4]: oder numbers
[5]: natürlich als pdf, hier der einfachheit halber als .png-bild
ps: fast noch schöner sieht’s mit logarithmischer y-achse aus; dieser plot wurde mit der leicht modifizierten version des latex-codes (hier zu finden) erstellt.

update: tobias diekershoff hat heute ein viel schöneres skript und eine viel fundiertere aussage über die anzahl dents veröffentlicht. falls es jemand interessiert: hier weiterlesen!