since i’ve been mentioned in the berner zeitung two weeks ago i thought it’s time to take a look at the access-statistics of my site once again [1].

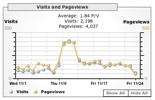
 since i let google get some data about my visitors, i also have a fancy-schmanzy widget, that shows me at a quick glance if something remarkable is going on (click on the left image for bigger view).
and i have to say that one could really see that quite some people came to my site in the days after the article came out [2]. one can see it much better on the following graph, when it’s not the naked numbers… on friday the 10. november the article came out and in the two following days i had around 2-3 times more people on my little website than normal (click right image for slightly bigger view). quite nice, innit?
[1] if you want to look for yourself, they’re available in un-pretty form here. (für den schwanzlängenvergleich….)
[2] btw: it’s now available as pdf here…
Technorati Tags: analytics, bz, google, nabaztag, statistics
Leave a Reply